 There are a few things in golf that are considered – or better yet – assumed to be true. I thought it might be interesting to run down some of these items and find out if they really are true or if the numbers say otherwise. I’m not looking to single out one certain area, but cover a few things that one might take for granted without looking a bit deeper.
Read on to find out if any myths were busted.
Myth #1: The longer a player drives the ball, the closer he or she will hit it to the pin.
Common sense tells you that you’re more likely to get close to the pin from 120 than you are from 150, right? After all, the closer you are to the pin, the better your chance is to hit it closer on subsequent shots… right? That sounds right. Last week in the forum, this was assumed by one of the posters and I thought that it made sense, but I took it upon myself to look a bit more into the data to see if it was true. Most anyone would want a shorter iron into the hole, but how does the graph look for Driving Distance (DD) versus Proximity to the hole?
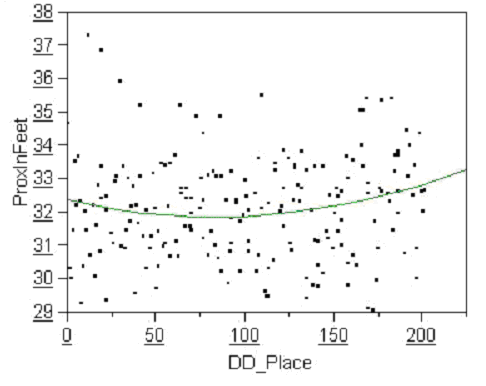
The rsquare value, a measure of how closely the points fit a best-fit line, is 0.02. A perfect fit is 1. Anything less than 0.1 is so bad as to be considered absolutely unrelated.
I never expected to see anything like this. I, like most people, thought that the fit line would be a more severe slope from the top right (shorter and less proximate) to the bottom left (longer and more proximate). Instead, the distribution is scattered and the fit line doesn’t even really fit. Another poster wondered what the Driving Accuracy (DA) would look like. Here it is:
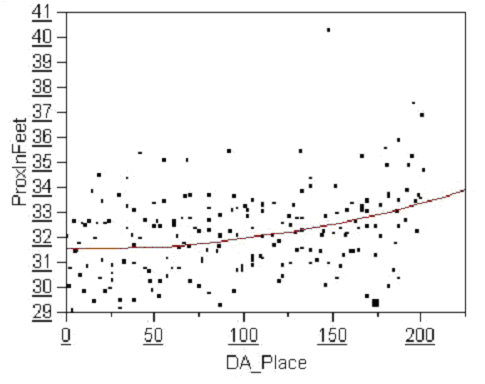
The rsquare value for this graph is 0.11 – five times more than the driving distance graph!
Still not great, but it fits much better and the distribution is much tighter. This leads us to the conclusion that you are better off, from a proximity standpoint, to be in the fairway back a few yards, than in the rough further ahead. Myth #1: Busted
Myth #2: Players that miss more greens average less putts.
Think about it. If you miss a bunch of greens and have a decent short game, the chances are you will have less putts by getting up and down. For this reason, the PGA Tour uses putts per GIR to determine the best putter on tour. They don’t want any other part of the game skewing the results. So the question remains… does GIR affect the number of putts that much or does great putting win out?
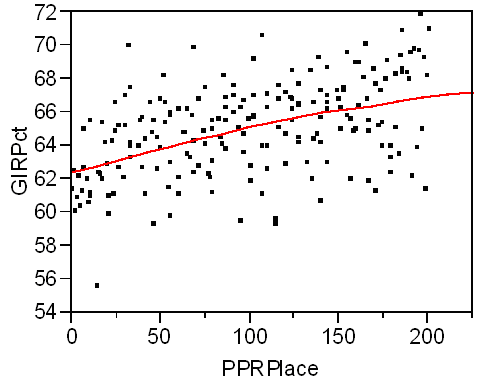
For what it’s worth, the rsquare value of this graph is 0.228. Not great, but not too shabby either.
In the back of my mind, I thought that the distribution would be a little scattered. Looking at the graph above, those thoughts are put to rest. Myth #2: Proven
Myth #3: Players years ago had better feel and better short games.
In other words, guys today are just big oafs that hit it as hard as they can, consequences be damned. Any way you look at it or state it, this is something that is hard to prove by the numbers. I’ll focus on one area to see if we can prove or bust this myth.
Guys do hit it longer today, that’s for sure. But what about putting? The same stats in putting have been kept for years now so we should be able to do a decent job of comparing players, right? Well, it isn’t that easy because we have to assume that all other factors remained the same… and we know that conditions in the 80s were much different than today.
Myself, I would contend that today’s conditions are more difficult given the speed and contour of the greens. I’ve been to a recent US Open to see this first hand. Others may think that conditions 20 plus years ago were harder because greens were not as smooth and reliable as they are today.
So what do the numbers say? That putting wasn’t as good then as it is now. Here’s the top 10 in each year:
2005          1986
1   1.710     1   1.736
2   1.713     2   1.758
3   1.715     3   1.761
4   1.727     4   1.764
5   1.731     4   1.764
5   1.731     6   1.766
7   1.733     6   1.766
7   1.733     8   1.767
9   1.734     8   1.767
10  1.737     10  1.768
As you can see, the numbers in 1986 were not good. In fact, 10th place in 1986 would have finished below 60th in 2005. The leader, Greg Norman, with his 1.736 average would have been 10th, but after that, it drops of significantly. So what about total putts?
2005          1986
1   27.79     1   28.39
2   27.96     2   28.47
3   28.06     3   28.54
4   28.09     4   28.61
5   28.20     5   28.78
6   28.29     6   28.79
7   28.32     7   28.94
8   28.40     8   28.97
8   28.40     9   29.00
10  28.47     10   29.01
Again, the numbers are not too good for the putting of the past. Total putts compare even worse than putting average did. Myth #3: Busted… with an * (due to the reasons stated above).
Thoughts
There are a lot of assumptions and myths in any sport and golf isn’t any different. I was surprised that longer players don’t hit it closer and not surprised that putting totals fluctuate with GIR. I’m hoping to stir the pot a bit and see if anyone has myths or beliefs that warrant some closer looks. Leave a comment. It may be a future topic of this column.
Re: Myth #1
David Pelz has some great analysis of this particular issue in his book “David Pelz’s Short Game Bible”. Basically, Pelz argues that the driving game and the short game are two different skill sets that do not correlate with one another.
The other point that Pelz brought up that was interesting is to remind is that hitting a full-swing shot is much easier than trying to hit a “partial” swing shot. So, Pelz says that just because you can blast the ball far, but leave yourself a 50 yard shot doesn’t mean you will get it any closer because trying to hit that 50 yard shot require some adjustments to your swing. If I remember correctly, Pelz suggests that you try and hit the ball to a distance where you can make a full swing with a wedge or other short iron.
Hans,
You make a good point about having a full swing. I would hope (and think) most pros already take this into consideration. I know that I will always take the 100 yard shot over the 50-60 yard one 99% of the time.
Even though the two skills (Driving and Short Game) are very separate skills, how you manage driving/distance can affect the short iron/wedge game.
Thanks for the comment!
Koster, you are a genuis. The “Myth Busting” idea is great and you hit home run with this piece. I hope this puts to rest once and for all the idea that bombing it off the tee means you’ll get it closer to the hole with your irons. Developing an accurate tee game is of the utmost. Even so, I’m gonna try and kill it off the tee on Friday. 😉 Because its fun.
Dave, you mentioned – “I know that I will always take the 100 yard shot over the 50-60 yard one 99% of the time.”
I took that advice from our pro a few years ago. It included learning some discipline. But, I finally learned that (in assessing the shot) if I am not confident that I could put three balls out of five on the green below the flag, I’m better off to put myself 90 -105 away at the best angle of approach I can manage.
Sometimes I take flack for laying up from 220 but the scores prove the theory.
Myth #3 Statistics can be misleading. The surface of greens of yesteryear were not as smooth and as fast as they are today. When I first took up golf in the 70’s the greens were relatively slow and could not compete with the new hybrid grasses of today; for another thing the equipment to mow at micro-heights was not possible on equipment of that era. Conclusion–the myth still could be true that they were better putters years ago; then again, who knows?