 A couple weeks back I discussed driving distance and accuracy. Neither really stood out as being a major factor in scoring average or earnings. In fact, when I removed the top earners, the numbers leveled out even more so. I suggested, that greens in regulation and putting average would play a larger role (or factor) in money and scoring.
This week in The Numbers Game, I’m finding the answer to the above suggestion and sharing what I’ve found. Was I right?
In a word, yes.
Well, obviously it isn’t that simple, but what I found was that my inital thoughts were true. I’m not bragging, just happy that something I suggested is right. I’m just trying to redeem myself after picking Furyk to win the British Open. Anyway, let’s look at the data, shall we?
The data I used, again, is right from the PGA Tour’s stat website. I used six different stats to collect all the data I needed:
- Scoring Average
- Earnings
- Driving Distance (DD)
- Driving Accuracy (DA)
- Greens in Regulation (GIR)
- Putting Average (PA)
Scoring
The first step I took was to join the Scoring Average stat to DD, DA, GIR, and PA. This gave me tables that had each players place in those categories with their corresponding Scoring Average. Now I could plot for each stat where they finished in it on a horizontal (X) axis and the scoring average on a vertical (Y) axis. I put the best finishers on each stat on the left, starting with number 1 and went to over 200 all the way on the right. Below is the GIR graph:
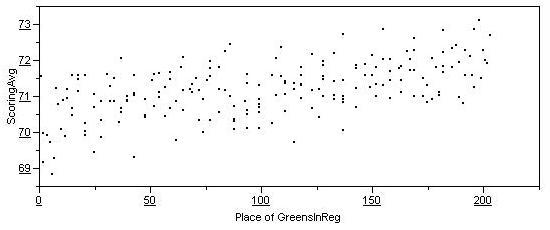
As you can see, the graph slopes from the bottom left to the upper right meaning as the place in GIR gets progressively worse, the average score for the players gets higher. There aren’t even many outliers…the slope is relatively tight. This was the first bit of proof.
The next step was to plot the same exact graphs for the three remaining stats:
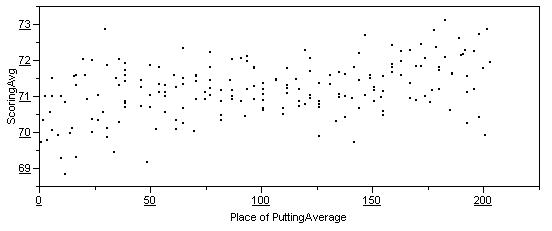
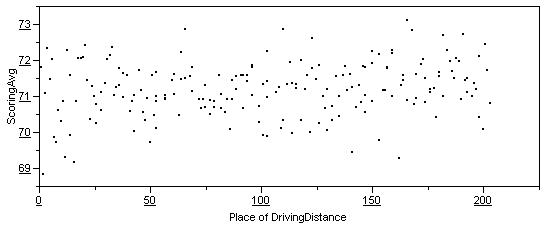
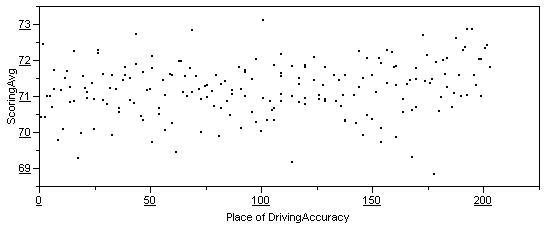
Again, for PA, the graph slopes from bottom left to upper right. I’ve added the same format for DA and DD for comparative purposes. With DA, there is a slight slope, but not as much as you see in PA or GIR. DD, well it is all over the place. The slope is extremely small and demonstrates that driving the ball further far does not necessarily mean scoring will drop.
Earnings
To hammer the point home, I wanted to do the same for earnings as well. I like to use the amount a player earns per event rather than total earnings. It is a little bit fairer of a representation and it accounts for the fact that players play different numbers of events. The graphs are a little different, but the result is the same. In the following graphs, I plotted for each stat where they finished in it on a horizontal (X) axis again, but the vertical (Y) axis is earnings per event.
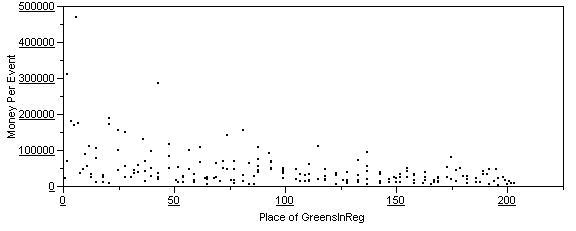
This graph slopes from the top left to the bottom right. The meaning is that the higher earners are at the top of the GIR stat. Again, this distribution is tighter and there are not as many outliers.
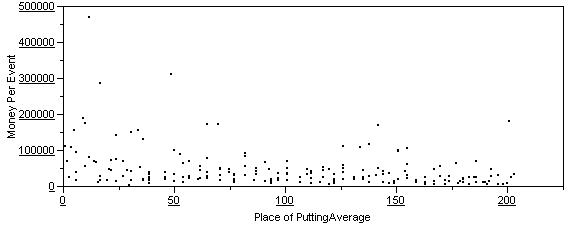
Looking at PA, the graph slopes similarly to the upper left. There are a few outliers and it isn’t as clean as GIR, but there is still a gradual turn to the upper left.
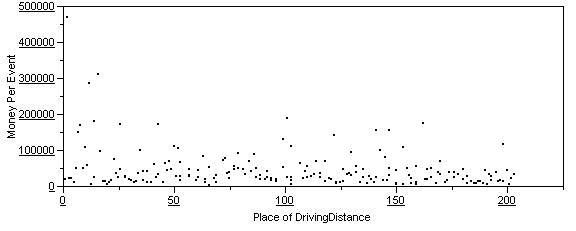
With DD, it is pretty flat until you get to the top 20 or so in DD. This is the Tiger factor I talked about in my other article. While you can’t ignore this factor, when looking at the rest of the distribution, there isn’t much there.
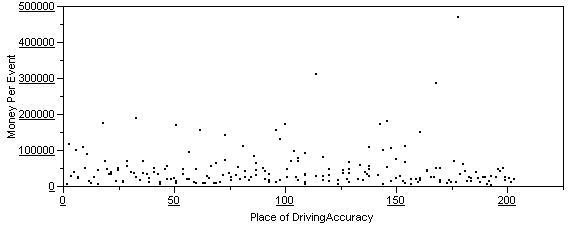
For DA, there is not much to speak about. No slope.
Conclusions
My goal was to see if the prediction was true: is putting and/or GIR a larger factor in scoring and winnings? Looking at the data, well, I already told you the answer. Both statistics show a strong correlation with earnings and scoring. Probably the most interesting thing discovered by the analysis is that GIR correlates best of all stats. I didn’t think that there would be one stat that stood out more so than the others. The premium these days is being placed on accuracy into the greens and then putting.
I’m starting to think that the adage “Fairways and Greens” should be changed to “Greens and Putting” or something sharper. Maybe someone out there can suggest something better. I’d like to hear a couple.
I agree with your assessments.
Obviously GIR is going to be a better representation of low scoring than driving (DA) is. Driving is one shot removed from getting the ball in the cup from the GIR stroke. That’s one more shot to screw up (the approach shot). That doesn’t mean that the accurate drive was less useful of a skill to have in scoring low. It may just mean that it’s damn hard, even for pros, to get two shots in a row (drive and then approach) perfectly executed on the golf course.
I’m certainly agreeing with you about GIR. It is a MUST to be on the green in regulation when you play in the PGA. When I play, on the other hand, it’s a bonus.
Maybe an analysis of course conditions would be in order. It has been opined in a couple of articles here (yeah, somebody really reads those) that short grass, big bounces, and long rolls have more to do with driving distances. Are there any stats out there that measure that sort of thing for tour courses. I know that stimp meters measure the greens, but is there anything similar for the fairways? That would be an interesting analysis when compared to driving distance and scoring average.
Another thing to think about is the ability for a player to save a bad tee shot with their next approach. The players that score low and win a lot are the ones that can make the great up and down saves, regardless of driving accuracy. Because of this, they may not have to worry quite so much with accuracy and can go long if needed (see Tiger). The up and down saves statistic may be as good of an identifier of play as GIR.
Additionally, the best identifier of a winner is probably just the simple “putts per round.” But I could be wrong.