 So my picks were a bit off last week. Choi withdrew and well, I won’t go into the rest. It was a great week of golf though, with a couple of big moves made by Chad Campbell and Tim Herron. At least I was right about the number of players that would drop out. Two guys, Ogilvy and Maruyama, were the unfortunate ones.
Now that we have the top 30 I wanted to look a little further into who these players are. Earlier this year I went into great detail about Greens in Regulation (GIR), Putting Average (PA), and other statistics. I wanted to see where the top players stood in each and if the same trends we found earlier still held up. Let’s have a look…
Driving Accuracy (DA)
Early on in my research, Driving Accuracy quickly made itself evident as a poor indicator of success. The average place on the DA list for the players in the top 30 is slightly over 100 – right about smack in the middle of the pack. There are some extremely accurate drivers like Fred Funk but there are many inaccurate ones like Tiger as well.
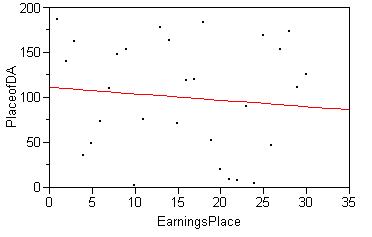 For each of the categories, I ran a best-fit line just like I have in other columns to be consistent. To the right, you’ll find the graph for DA vs Earnings Place. The highest earners are on the left side of the graph and the players just making the Tour Championship are on the right. The more accurate players off the tee are on the bottom. Enough about the graph…
DA has a negative slope. This means that as players hit fewer fairways, they made more money… at least in the Top 30 that is the case. Two caveats exist, however. First, the slope is not severe: it’s nearly horizontal. Second, the best fit line is really not incredibly tightly fit – dots exist all over the place, and while a best-fit line provides some indication, it can really only be seen as a trend line with a much more closely packed set of data. At the very least, we still know that DA doesn’t mean much for players trying to earn more money.
Driving Distance (DD)
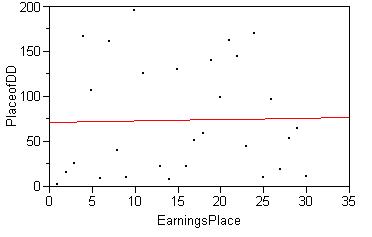 This is always the fun stat. Everyone likes to discuss how long they are off the tee and the debate raging on today is all about distance and its effect on golf. From the looks of it, it still is not significant when it comes to earnings on the PGA Tour. The average place on the DD list for the top 30 is 74.17. As for the slope of the line?
I feel like I should be holding those paddle things, putting them on someone’s chest and yelling “CLEAR!” That line is about as flat as it gets. Beyond that, well, I haven’t got much more to say that I haven’t said before.
Putting Average (PA)
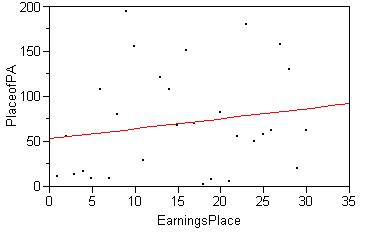 I’ve always liked the saying “Fairways and Greens.” The research I’ve done for this column has led me to change this to “Greens and Putting.” Putting had much more of an impact on scoring and earnings that hitting fairways that such a change in my mantra only made sense. The average place for the top 30 on the PA list is 70.9 which is only slightly better than DD. The big difference is that the fit line is sloped much more from top right to bottom left implying that putting is a bigger factor.
See the nice sloping line? I don’t feel the need to yell anything here.
Greens in Regulation (GIR)
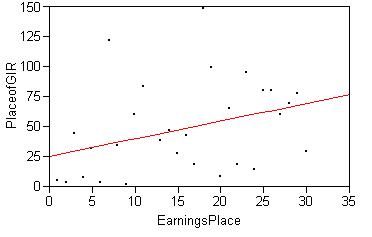 I’ve always said this is the most important stat… and this graph shows that it’s still true. For the top 30, the average ranking was 48.45. This is easily the lowest of the four major stats.
When graphed, it’s obvious that not only is the slope greater, but the points on the chart are not as scattered in the other ones: they hug the best-fit line much better. I wasn’t surprised.
Final thoughts
Greens are good. I’ve said it before, I’ll say it again. The best players in the world all do it very well and hitting greens is something I’ve started focusing more in my own game. I enjoy research for that reason. I can look at these guys and the numbers behind their game and see what makes a difference in success. Sometimes it leads to more quesitons, but that makes it all the more interesting.
2 thoughts on “Top 30 – In Numbers”