
 Dave Koster has the week off, so I’m filling in for him. This week, we’ll be talking about handicaps, course ratings, and slope, as well as how you can take this knowledge to improve your odds of winning a few more bets. For the purpose of this article, I’m going to assume that you know how to calculate your own handicap index. If you don’t, read the appropriately titled “What’s Your Handicap?” and come back. I’ll wait.
A Bit of History
Golf is the only sport in the world that allows the average schlub to play – and compete on an even footing – with the best in the world. It’s lost to the sands of time who first asked his opponent for strokes in order to have a fair match, but the idea of handicapping has had a massive impact on the way we play the game of golf.
Originally, golfers figured their handicap by how much worse they were than the best player at their club. This crude method worked well enough on your home course, but failed miserably as soon as you traveled to a different course with a different best player. Some courses, even with matching par totals, are simply harder than others. Course ratings – the smaller number typically between 65 and 75 on your scorecards – tell us what score the average scratch golfer will shoot half the time, but they can’t do much to tell us what someone who has trouble breaking 100 will shoot. USGA researchers found that as courses got harder, scores went up faster than a player’s handicap.
Along came Dean Knuth, and the “Slope” ratings system was invented. This is the number ranging from 55 to about 155 on your scorecard, though typically the number is around 113, the average. You can think of a slope rating as a measure of the course’s difficulty for a bogey golfer.
Let’s take a look at how slope affects play plays out.
A Tale of Two Courses
Imagine two courses, both of which have the same course rating. It’s unimportant what it is, but for the sake of the graph we’ll assume that it’s even par. The two courses each have their own slope rating, though. One is 100 and the other is 126, both 13 from the defined average of 113.
If we chart the handicap strokes allotted to golfers with handicap indexes ranging from 1 to 36, the gap between 100 and 126 becomes evident:
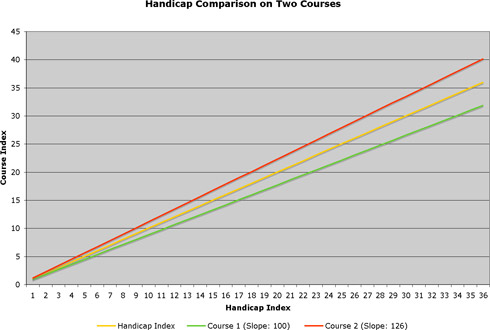
The “slope” rating is called the “slope” rating because it affects the slope – or “slantedness” – of the lines in the graph above.
In the chart above, the yellow line shows how many handicap strokes a golfer would be allotted on a course with a slope of 113 – the same as their handicap index. The red line shows the number of strokes given on the course with a slope of 126 and the green line on the course with a slope of 100.
Since both courses have the same course rating (even par), a scratch golfer’s “better half” scores should be around even par on both courses. It follows that a golfer with a handicap index of 1.0 is given one stroke on each of the two courses, a golfer with a 2.0 index is given two strokes, and so on through four. The two courses begin to separate themselves when a golfer with a handicap index of 5.0 steps onto the first tee at each: at the harder course, he’s given six strokes, and at the easier course only four. This is due to rounding: his course handicap on the easier course is 4.42 and on the harder course 5.58, which round to four and six. One index point earlier, at 4.0, both players get four strokes by an even slimmer margin: 3.54 to 4.46.
This gap enlarges as the handicap index increases. An 18-handicapper gets 16 strokes on one course and 20 on the other, and someone with a 36.0 index gets 32 strokes on the easier course and 40 on the tougher one. They’re always, in this contrived example, equidistant from the handicap index because they’re equally harder or easier versus the standard 113.
Index        Slope: 100          Slope: 126

-----        ----------          ----------

1.0          0.88     1          1.12     1

2.0          1.77     2          2.23     2

3.0          2.65     3          3.35     3

4.0          3.54     4          4.46     4

5.0          4.42     4          5.58     6

6.0          5.31     5          6.69     7

7.0          6.19     6          7.81     8

8.0          7.08     7          8.92     9

9.0          7.96     8         10.04    10

10.0         8.85     9         11.15    11

11.0         9.73    10         12.27    12

12.0        10.62    11         13.38    13

13.0        11.50    12         14.50    14

14.0        12.39    12         15.61    16

15.0        13.27    13         16.73    17

16.0        14.16    14         17.84    18

17.0        15.04    15         18.96    19

18.0        15.93    16         20.07    20

19.0        16.81    17         21.19    21

20.0        17.70    18         22.30    22

21.0        18.58    19         23.42    23

22.0        19.47    19         24.53    25

23.0        20.35    20         25.65    26

24.0        21.24    21         26.76    27

25.0        22.12    22         27.88    28

26.0        23.01    23         28.99    29

27.0        23.89    24         30.11    30

28.0        24.78    25         31.22    31

29.0        25.66    26         32.34    32

30.0        26.55    27         33.45    33

31.0        27.43    27         34.57    35

32.0        28.32    28         35.68    36

33.0        29.20    29         36.80    37

34.0        30.09    30         37.91    38

35.0        30.97    31         39.03    39

36.0        31.86    32         40.14    40
Define “Difficulty”
 Slope is defined as the relative difficulty of a course, but how do you define “difficulty?” What can increase or decrease a course’s slope rating? Do wide fairways make a course that much easier? How about large water hazards? Long rough? Small greens? Deep bunkers, changes in elevation, or strong winds?
Without going into too much detail, course raters have devised a method to determine slope by computing the average better-half score of a model bogey golfer. Raters compare this score with the computed better-half score of a scratch golfer. The difference between them is calculated, and the slope of the resulting line is the slope, or relative difficulty, of the course.
USGA course raters weigh several factors when computing difficult for the two golfers. It’s interesting to look at how the features of a course are weighted:
                 Weight

Obstacle              Scratch     Bogey

--------              -------     -----

Topography              10%        12%

Fairway                 11%         9%

Rough/Recoverability    14%        15%

Out of bounds           10%         9%

Water Hazards           14%        14%

Trees                    9%        14%

Bunkers                  7%        10%

Green Target             9%         6%

Green Surface           11%         8%

Psychological            5%         3%

                       ----       ----

                       100%       100%
These characteristics are defined as follows:
- Topography – Difficulty of stance in the landing area and the vertical angle of shot from the landing area into the green.
- Fairway – The effective width and depth of the landing area, which can be reduced by a dogleg, trees or fairway slope.
- Recoverability and rough – The existence of rough and other penalizing factors in the proximity of the landing area and the green.
- Out-of-bounds – The existence of out-of-bounds in the proximity of the landing area and around the green.
- Water hazards – The existence of water in the proximity of the landing area and around the green.
- Trees – The strategic location, size, height and number of trees.
- Bunkers – The existence of bunkers in the proximity of the landing area and around the green.
- Green Target – The size, firmness, shape and slope of a green in relation to the normal length of the approach shot.
- Green Surface – The contour and normal speed of the putting surface.
- Psychological – The mental effect on play created by the proximity of obstacles to a target area.
You might assume that tricky greens and narrow fairways would affect the bogey golfer more than the scratch golfer, but let’s think about that assumption. The bogey golfer can be thought of as someone who gets up and simply tries to hit the ball in the middle of the fairway and then onto the green.
A bogey golfer rarely aims at a specific portion of a fairway, while the scratch golfer is playing for position. Put another way, a bogey golfer is almost as likely to screw up his approach shot from the fairway or the rough, while a scratch golfer would much prefer to be in the fairway. Missing the fairway isn’t as big a deal to a bogey golfer.
The same holds true of green target and surface. A bogey golfer isn’t aiming anywhere but “towards the flag,” while a scratch golfer is trying to place his approach shot in a particular section of the green, resulting in more weight given to scratch golfers in “Green Target” and than bogey golfers. Finally, it’s been said that a bogey golfer can three-putt from anywhere, but one-putting becomes difficult for a scratch golfer the more undulation a green has, resulting in a “Green Surface” weight that favors the scratch golfer.
Naturally, things like trees – in which a bogey golfer is likely to find himself far more frequently than a scratch golfer – and bunkers are weighted in favor of the bogey golfer.
And, though I’ve muddied the waters by making comparisons between the two golfers, it’s important to remember that these percentages are relative weights, so we can only make accurate comparisons within each category. For example, topography – or awkward, sidehill stances are four times more likely to affect a bogey golfer’s score than intimidating obstacles (“psychological”) and twice as likely as green targets (12% to 3% and 6%, respectively).
Steady Eddie and Wild Willie
80% of all bogey golfers fit the model defined by course and slope ratings within one stroke. The remaining 20% is occupied by two players, and Dean Knuth calls them “Steady Eddie” and “Wild Willie.”
Steady Eddie represents about 12% of all bogey golfers. He hits the ball very straight but not very far. He has an outstanding short game. When Steady Eddie is taken from a short course to a long course, his score increase is greater than the model would show. Thus, on high-slope courses, he’s typically underhandicapped.
Wild Willie is a long but inaccurate hitter. He represents about 8% of all bogey golfers. On a long, open golf course Wild Willie is over-handicapped. Conversely, on a tight, punishing course he can be under-handicapped.
Your Anti-Handicap
One of the more interesting statistics I’ve begun keeping is my “anti-handicap” index. You figure your handicap index by taking the best 10 of your last 20 scores (your “better-half” scores). Logically, your anti-handicap uses your worst-half scores, or your worst 10 of your last 20.
Currently, my handicap is 4.0 and my anti-handicap is 7.5. This means that on my course with 134 slope and a 70.5 course rating, my best scores tend to be around 75 (4.0 * 134 /113 + 70.5 = 75.24) and my worst scores tend to be about 79 (7.5 * 134 / 113 + 70.5 = 79.39). That’s a range of four strokes. In terms of the two abnormal golfers above, the consistent Steady Eddies of the world have small gaps between their handicap and their anti-handicap, while inconsistent Wild Willies tend to have quite large gaps.
Choosing a Partner
Knowing someone’s anti-handicap is important when you look to choose a partner for a best-ball match or in negotiations on the first tee. Imagine a Steady Eddie type of golfer with a handicap index of 5.0 and an anti-handicap of 7.0. The best partner for Eddie is a Wild Willie type with a handicap index of around 15.0. Wild Willie’s anti-handicap may be 25, but this pairing assures the twosome that Steady Eddie will keep them in the match with a string of pars, and occasional flashes of brilliance from the inconsistent Wild Willie will provide net eagles and birdies. Wild Willy, you see, is as likely to make birdie or par as he is double or triple bogey.
In fact, most golfers would do well to select a partner who is quite opposite their style of play and about ten strokes away from their handicap. Two golfers with the same handicap almost always lose to a pair of golfers with very different handicaps. The two opposites will “ham and egg” it a lot more frequently than the guys who are likely to record the same score as each other on every hole.
The End
This week was a bit of a hodge-podge of inter-related ideas: a course’s slope rating is a measure of the relative difficulty for the bogey golfer. Difficult courses punish bogey golfers more than they punish scratch golfers, and several factors have weight in determining a course’s slope. Slope works for 80% of golfers out there, butt the remaining 20% is either a Steady Eddie or a Wild Willie, and knowing which one you are and which one you should partner with will increase your odds of taking some money off of your pals.
What a great article. So informative yet simple enough for anyone to understand. I’ll probably read it a few more times to really soak up all the information.
Here is the question: What are the odds a 14 and 15 handicapper can shoot even par for 15 holes, best ball of the twosome, no strokes. Three birdies, three bogies, the rest pars.
Jim, check out this USGA.org article for as good an answer as can be provided.
It seems reasonable they could do that.