
 In February, nerds, statisticians, sports fans, and nerd-statistician-sports fans gathered in Boston, Massachusetts for the MIT Sloan Sports Analystics Conference. Since its establishment in 2006 by Houston Rockets GM Daryl Morey, the conference has grown to feature athletes, media members, and statisticians from across the sports landscape.
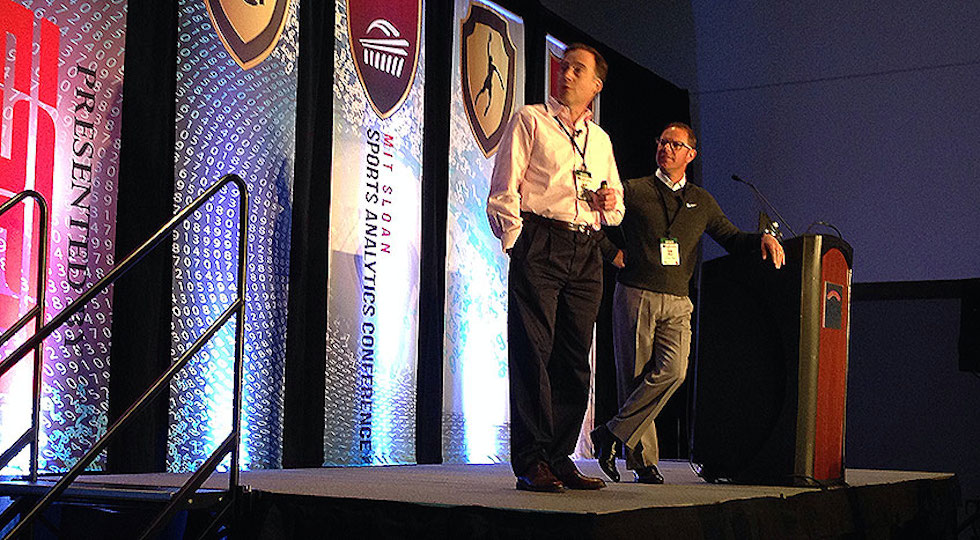
Sean Foley, swing instructor to Tiger Woods, has been a vocal leader when it comes to the marriage of science and golf. He spoke at the conference alongside golf statistician Mark Broadie. One of the most outspoken adopters of TrackMan, an advanced launch monitor that uses Doppler radar to track ball flight and impact characteristics, Foley also coaches Justin Rose and Hunter Mahan, and is so busy that he recently had to turn away Luke Donald.
Analytics have revolutionized the way fans watch, talk about, and consume baseball and basketball, and now that’s finally coming to golf. Let’s dive in.
Recent History of Analytics
It would be an unimaginative oversimplification to say that what we’re seeing with golf is akin to the events of Michael Lewis’s Moneyball. The Moneyball revolution was all about identifying inefficiencies in the way that MLB organizations evaluated their players. Oakland A’s GM Billy Beane, and others, realized that on-base percentage was a better indicator of hitting ability than batting average, that there were more accurate descriptors of fielding ability than fielding percentage (sorry, Derek Jeter), and that runs batted in are mainly a function of the lineup around a player than some sort of intrinsic ability of certain hitters to drive in runners. They used the already-available resources, mixed in some brute force (humans visually tracking plays in the field), and added a bit of 21st-century common sense into a game whose statistics had long been limited to box score numbers. It was advanced, but nothing like what we’re seeing currently.
No, the basis for golf analytics was actually established before that for baseball. ShotLink, the PGA Tour’s data collection system that tracks and compiles the results of every shot hit on Tour, was first launched back in 2001, and was made public shortly after. The PGA Tour made the full wealth of data available to graduate programs at universities with the hope that someone would figure out what to do with it.
![]() Early on, that was their real problem. ShotLink was a system built for the future but without a present-time need or demand. Baseball and basketball, however, have faced the inverse problem. With a growing demand for next-level analytics, the sports lacked an advanced way to collect the data. Until now. (Well, several year ago, actually).
Early on, that was their real problem. ShotLink was a system built for the future but without a present-time need or demand. Baseball and basketball, however, have faced the inverse problem. With a growing demand for next-level analytics, the sports lacked an advanced way to collect the data. Until now. (Well, several year ago, actually).
Major League Baseball launched PITCHf/x in 2006, with full integration the next year. Per FanGraphs.com, PITCHf/x “tracks velocity, movement, release point, spin, and pitch location for every pitch thrown in baseball, allowing pitches and pitchers to be analyzed and compared at a different level.” The two-camera system is primarily responsible for the Gameday viewing system that all MLB teams offer. Several years later, Major League Baseball unveiled FIELDf/x and HITf/x, similar systems that track, you guessed it, fielding and hitting. Now more than ever, baseball teams have a next-generation way of tracking and quantifying the action on the field.
Basketball, which even the most stats-crazed fans have long assumed would be among the hardest sports to quantify, is undergoing a similar revolution. Over the last few years, the NBA and STATS have installed six SportVU cameras in every arena, and have been able to track players with a amazing level of accuracy. SportVU camera can show which players touch the ball more, capitalize on their rebounding chances better, and shoot better in different situations (catch-and-shoot vs. pull-up shots). While analysts and broadcasters once used the number of fouls a player drew to extrapolate how often they were driving to the basket (rather than settling for jump shots), they can now simply pull up a statistic that will tell you who drives to the basket the most often (Monte Ellis is this season’s leader). Hustle is no longer something that color commentators yell out in excitement about, it’s an actual definable quality.
Golf Stats Today
Golf is probably the easiest sport to track extensively. Anything that can’t be measured by TrackMan or FlightScope radar (swing speed, other launch conditions) or by laser and GPS (distances, exact ball locations) can be viewed manually. Whether a player hit a cut, which club they used, the wind speed and direction, etc.
The real trick is finding something to do with that data.
Golfers and analysts have known for a long time that the common statistics have limitations. The driving distance stat was only measured on two holes of the course, and though the tournament directors took precautions to gather accurate data (picking holes that run in opposing directions to counteract wind effect, that were generally flat, where players would be expected to hit drivers), it was an imperfect statistic. Today, all drives can be measured.
Greens in regulation is another example. It’s a decent indicator of ballstriking ability, but there’s a distinct advantage for golfers who can hit it long. Bubba Watson, who drives the ball close to 315 yards on average, is going to have a much shorter club into each green than Mike Weir, who hits it about 270.
You can say the same for putts per round. Better ballstrikers will, in general, have closer first putts than worse ballstrikers, which will artificially deflate their putts per round. But really bad ballstrikers, who miss more greens, have an extra non-putt to get the ball close to the hole. That too can artificially deflate a golfer’s putts per round.
The key to advanced stats is separating out the parts of the game, which has been the key to effective analytics in other sports. Fielding Independent Pitching (FIP), for instance, is a baseball stat similar to ERA that removes fielding from the equation. xFIP expands on that, removing ballpark dimensions from the statistic. Ultimate Zone Rating (UZR), a defensive stat, attempts to quantify how fielders play regardless of how many attempts they see (for example, a shortstop on a team with ground ball-heavy pitchers will have more errors than a shortstop on a team with fly ball-heavy pitchers just because they’ll get more grounders hit to them; ditto fielders who simply have more range).
Early on, the best application of ShotLink data was simply adding accurate distances to every stat. You could track a player’s GIR between 100-125 yards, or how far they missed the edge of a fairway by, or how accurate a putter they were from within 10 feet. That was a step up in terms of separating the different parts of the game, but where it fell short was relating that data to overall performance.
The Future of Analytics in Golf
At the Sloan Conference back in February, Mark Broadie, the Columbia professor who expanded on the PGA Tour’s and MIT researchers’ “Strokes Gained – Putting” stat (one of the first advanced stats developed with ShotLink data), teamed up with Sean Foley to give a presentation. The duo talked about what many smarter golf fans have known for a while: that the long game tends to be more important than the short game, and that distance is more critical than accuracy.
They talked about how old adages like “drive for show, putt for dough” and logic like “a majority of your shots come from within 100 yards, so that’s where you should spend the most time practicing” were bunk. Broadie notes that from 2004-2012, approach shots represented 40 percent of scoring average, compared to 28 percent for driving, 17 percent for the short game, and 15 percent for putting. If you’re Foley, the usefulness of that data is in budgeting the time your students spend working on certain parts of the game, after taking into effect the rates of improvement in different parts of the game (i.e. how fast can you become a good driver of the ball versus a good putter of the ball?).
The two actually made a good pair – Broadie the statistician who focuses mainly on professional golfers, Foley the instructor who needs to boil the data down for consumption by mainly professionals but also amateurs.
Both of their points make sense if you think about them critically. While we tend to think of PGA Tour events (especially high-profile tournaments like The Masters) as coming down to putting contests, that overlooks all of the work the professionals put in to get to the spots where they have the “must-make putts.” Just because the difference between a win and second place quite often comes down to who can make a big putt (because all PGA Tour pros are great ballstrikers), we shouldn’t overlook the fact that all PGA Tour pros are great ballstrikers. They had to put themselves in position to make those putts. In addition, small differences in shot proximity can have a big impact on putting average. The myth that the PGA Tour is one big game of putt-putt is also simply not true. As Broadie mentions, the weekly leader in strokes gained – putting won just twice in 2013.
The first step to real next-level analytics came with the stat I just mentioned, Strokes Gained – Putting, and Broadie is currently working with the PGA Tour to refine the strokes gained statistic for shots away from the green. Later this year the PGA Tour will begin releasing Strokes Gained – Tee to Green, though that is simply taking the amount of strokes the player was from the day’s course average and subtracting their Strokes Gained – Putting.
Broadie has developed strokes gained stats for different parts of the game (driving, approach shots, short game, etc.), but he continues to refine his method. One current restraint is that the system assumes being closer to the hole is almost indiscriminately advantageous. And while that’s almost always true, there are limitations. Being short-sided, for instance, is sometimes worse than being a bit farther away and having more green to work with, especially on the fast, sloping greens common on Tour. ShotLink also struggles somewhat with taking the trees and other hazards in account.
While Broadie’s research has dealt mainly with the professional game, The Sand Trap‘s own editor-in-chief Erik J. Barzeski, along with fellow golf instructor David Wedzik, are in the process of writing a book focused more on the amateur game, called Lowest Score Wins. The basis of LSW was formed after studying data from golfers of all data levels, and aims to show even the highest-handicapped amateur golfers how advanced analysis of golf (similar to Broadie’s) can incorporate into their games through better practice, and on-course strategy.
In both baseball and basketball, cameras and player-tracking have become common ways to mine data, and we might someday see that make its way into golf. Just like how FlightScope and TrackMan radars are a perfect compliment to GPS data currently, the 3D golf swing systems might someday be married with the current infrastructure.
Nice article Jamo. There should be anti-stats for us too like strokes gained from not hitting it OB. This is half in jest. Penalty strokes are a big hit as your HC gets higher.
Well thought out and really well written. Thanks for sharing this with us. Statistics should be an integral part of anyone’s game.