 Tiger Woods has had a spectacular year by all accounts. Five PGA Tour wins and not a single missed cut, but no major victories. And that hurts, sure, but how much? Well, that’s what I am here to identify.
There’s a relatively simply stat that goes a bit beyond Old Man Par, called “z-score.” Z-score is simply a way of comparing how someone scores to how the rest of the field scored. For instance, during Jim Furyk’s 59 at the BMW Championship, the average score for all players that made the cut that week was 71.086. Z-score compares the player’s score to that average, and uses the standard deviation of the round’s scores to measure just how tough the course was playing on a given day. The number that the relatively simple formula spits out is a representation of how many standard deviations a player’s score was from the course average. Only the scores from players that made the cut are used, otherwise you would not be able to compare Thursday and Friday rounds to weekend rounds. (Players who missed the cut are, by definition, playing worse, and not having their scores in the weekend course averages would made it look like the course was playing much easier.)
A simple explanation about the ramifications of z-score is that despite shooting a 69 on Saturday and a 67 on Sunday at the TOUR Championship, Tiger’s Saturday z-score was actually better because the course played two shots easier on Sunday, and because the field’s standard deviation that day was a bit higher.
Using the tournament leaderboards from Yahoo! Sports (the PGATour.com ones were a bit tougher to import into a spreadsheet), I plotted an entire season’s worth of z-scores. (You can email or PM me for the full spreadsheet if you’d like.) I calculated the z-score for every player for every round, and then picked out the records of the PGA Tour Player of the Year finalists: Tiger Woods, Henrik Stenson, Adam Scott, Matt Kuchar, and Phil Mickelson.
How did they fare statistically? Read on the find out.
I should note here that I had to do the per-tournament z-score slightly different from usual. Because I was going to compare the entire seasons of several players (some of whom missed cuts), to get the weekly z-score I simply added the z-scores of the four rounds that player played, rather than calculating a separate value using the field’s final four-round scoring average. This was the best way for me to incorporate missed cuts and allow me to compare complete seasons, though you should avoid comparing my per-tournament values to those of another publication.
Without further ado, here are the results in the most simplistic form for the POTY finalists:
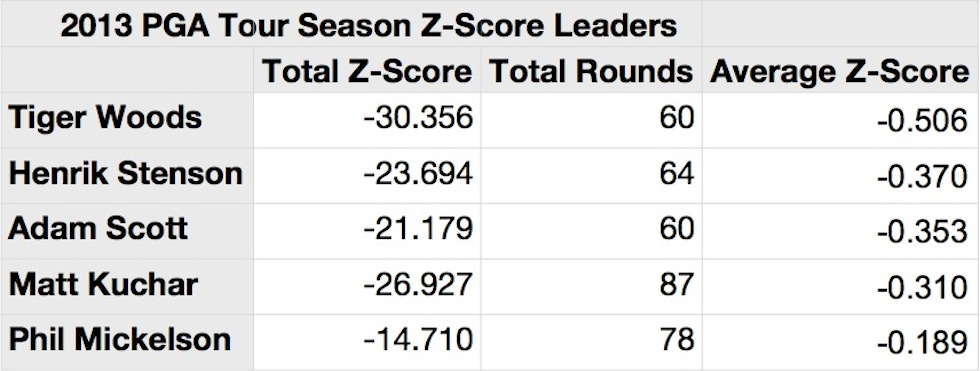
A lower (as in more negative) z-score is advantageous. As you can see, not only did Tiger Woods accumulate the best z-score, he did it in (tied for) the fewest rounds, and without missing a cut. (Missing a cut artificially helps a players z-score. If Player X shoots 76-76 with z-scores of 1 and 1.5, the fact that they don’t have to play on the weekend prevents them from accumulating what likely would have been bad z-scores.) This, obviously, gave Tiger the best average z-score, at right about -.500.
What does a -.500 z-score look like? Using Tiger as the example, a few include his third round at the TOUR Championship, his opening round at The Masters, and his closing round at the WGC-Cadillac Championship. That gives Tiger an average four-round z-score of -2.024, which would have been good enough for a sixth-place finish at this year’s Masters.
As for the non-statistical argument: if any other player had five PGA Tour wins, would this even be a discussion? I doubt it.
As I stated in the title of this column, Tiger Woods should be the 2013 PGA Tour Player of the Year, and it’s not even particularly close.
Below I’ve included a week-by-week breakdown of each of the finalists. (Note: I know the tables are a bit small. Click on them to use the site’s built-in Lightbox feature, or open them in a new tab. Again, if you’d like the raw spreadsheet, PM me or send me an email. I’d just ask that you not blatantly rip me off or something.)
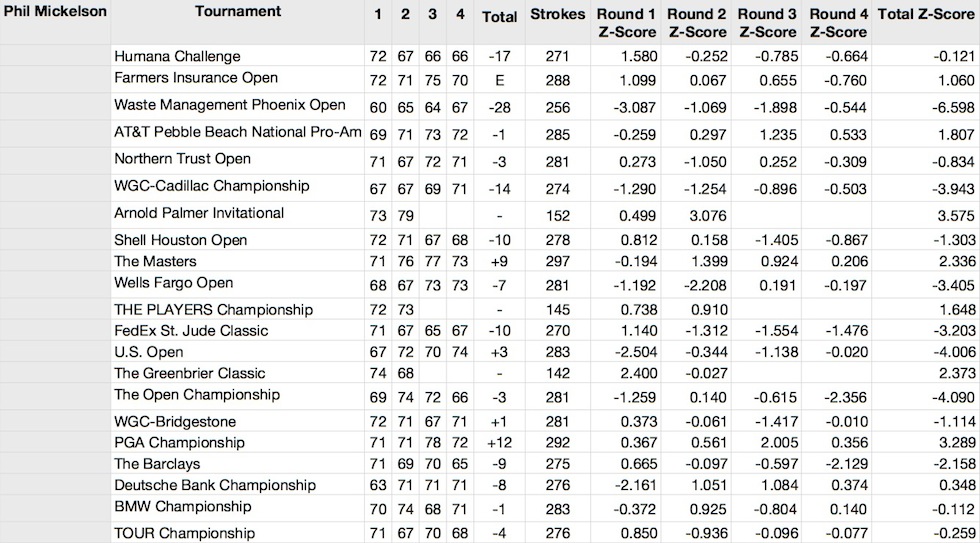
Tiger’s is first. It’s pretty easy to pick out his best finishes (including his five wins), and his worst tournaments (the Memorial, the Deutsche Bank, the TOUR Championship).
One thing that I didn’t include in the table below but calculated separately are Tiger’s z-scores for different days. We’ve seen Tiger apparently struggle on weekends, and the statistics bear that out. Tiger cumulative z-scores are -8.114 for Thursday, -9.845 on Friday, -8.407 for Saturday, and -3.980 for Sunday. His average Sunday z-score is about half of his overall average for a single round.

Henrik Stenson’s table below. Most notable about it is the back half of the season. Since the U.S. Open, Stenson has only finished worse than average in a tournament once, at The Barclays, and even that was by a very minuscule margin.
His finish at the Wells Fargo Open exemplifies one of the limitations of cumulative z-score. Both of his rounds that week we very, very bad; he averaged a z-score north of 2.200. If we extrapolate those numbers out (which wouldn’t be entirely accurate, but from my calculations is more likely than them turning it around completely), he would have a four-round z-score of nearly 9.000. The fact that the cut spared him two rounds (and that I didn’t extrapolate) helped his score considerably. This benefits less consistent players. Bubba Watson, for instance, is helped tremendously by the cut line (though his bank account might disagree).

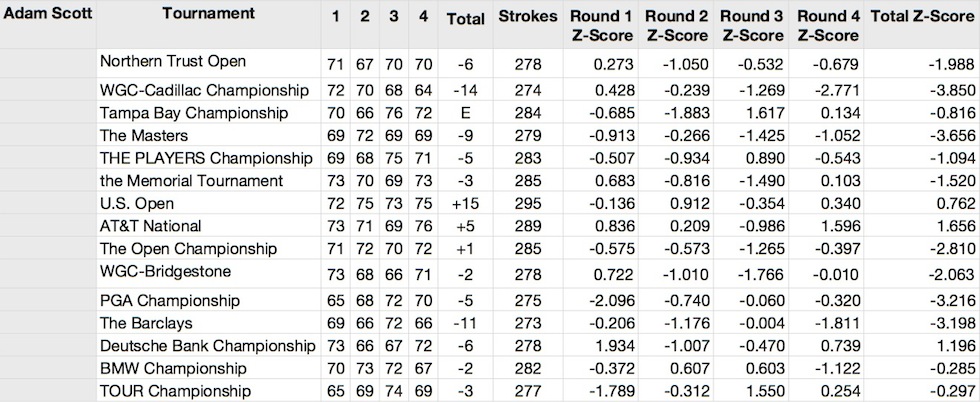
Next up is Adam Scott. One thing I found interesting here is that Angel Cabrera actually had a slightly better z-score during The Masters, by about .200.
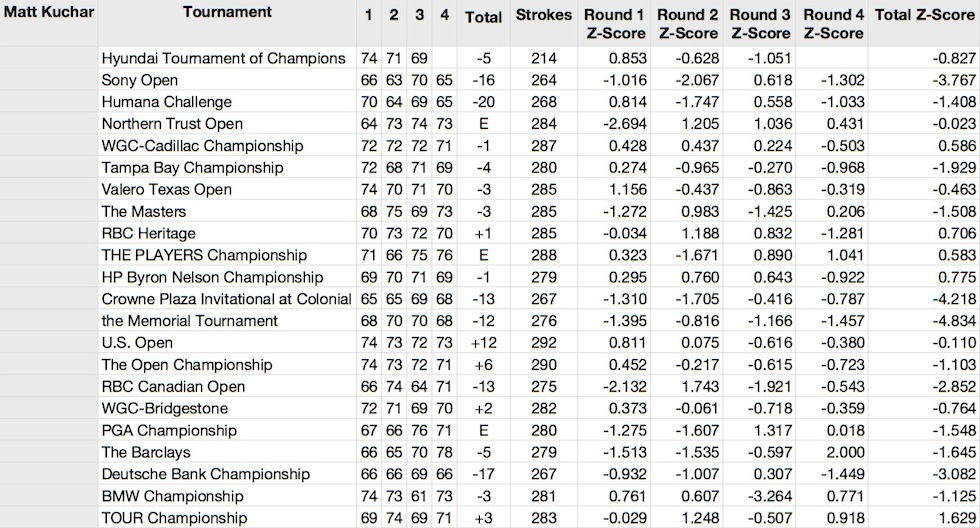
Kuchar’s table is next. I did, at one point, attempt to use the standard deviations of a player’s weekly z-scores to prove consistency. This gave me the conclusion that Kuchar was the most consistent player, just ahead of Scott, and that Tiger and Phil were by far the most inconsistent. That basically aligns with our perceptions of Phil and Kuchar, but it took me a minute to realize that Tiger’s consistency numbers were hurt by his own dominance. The tournaments that increased his standard deviation weren’t missed cuts and bad finishes, they were his five wins.
Last is Phil’s table. The inconsistency here is clear. Not only did he have several spectacular tournaments (Phoenix Open, U.S. and British Opens), he had several tournaments that were downright awful (Greenbrier, Arnold Palmer Invitational, PGA).
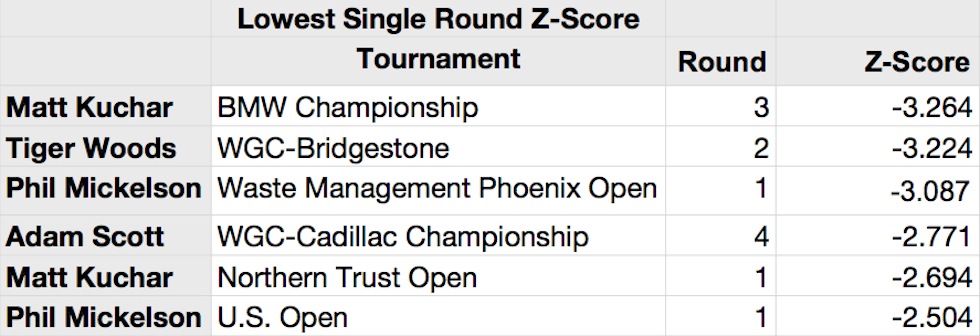
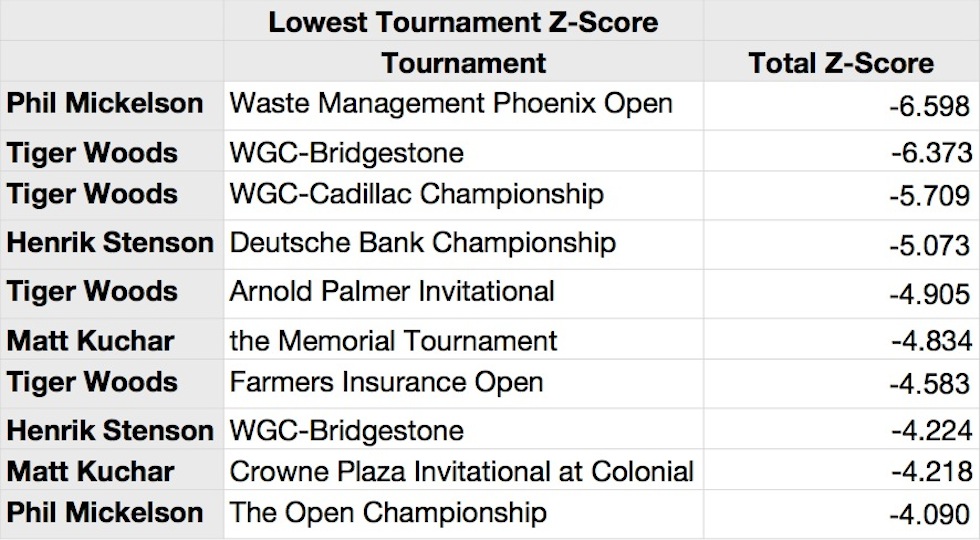
While I had the data, I also figured I ought to have a bit of fun. Considering only the POTY finalists, I looked at how the five players’ best rounds and tournaments compare. As you can see, the 61 that Matt Kuchar shot during the third round of the BMW Championship was the best round that any of the finalists shot, coming in just barely better than Tiger’s 61 at Bridgestone. Phil’s opening round at the Waste Management Phoenix Open led to the best four-round total though, and his final round at The Open Championship was the first to be left on the cutting room floor.
Looking at this table, you can see that four of Tiger’s five wins are in the the top 10 here, and that Henrik Stenson’s runners-up finish at the Bridgestone gave him a better score than most wins. That observation about Tiger essentially proves what people have been saying for a while: the fact that he plays mostly in tournaments with difficult fields (whether in spite of or because of his presence) hurts his stats. Can you imagine his Vardon Trophy chances if he took a yearly trip to the John Deere Classic?
Lastly, I should mention some caveats and limitations of z-score. First, I had to omit any tournament with an atypical scoring system. Namely, the WGC-Accenture Match Play Championship and the Reno-Tahoe Open (which uses a modified Stableford scoring system). Dropping the Match Play hurt Matt Kuchar since he won the tournament, but not enough to really change the final standings much. I did at one point test this, by giving him an average z-score for a WGC event winner, which kept him firmly in fourth place. None of these players played the Reno-Tahoe Open.
Another thing I did was treat “made cut didn’t finish” players as missing the cut for average score and standard deviation purposes, for the same reason I couldn’t include players who missed the cut outright. I also cut out all players who withdrew at any time during a tournament.
Z-score is a fairly dynamic stat that allows for modifications, one of which is using the past two years to create a basis for comparison to account for course difficulty. Because the last three majors and two of the FedExCup Playoff events rotate courses, and because it would have taken me roughly a fortnight to do all of that math, I decided not to go that direction. There are also ways to bring in performance from other tours, but since this is a PGA Tour award I didn’t go down that route either.
What was Stricker’s z score? Tiger was #2 behind him in adjusted scoring averge, actual scoring average and stroke differential against field average. He didn’t miss a cut either- maybe he should be POY.
Not sure about the others, but Stenson and Scott had better z scores for the majors than Tiger (and I am pretty sure that Stenson did for the playoffs also). Shouldn’t these events be given more weight?
If I have time I’ll put together a table for him later.
A big part of this analysis was avoiding adding things in arbitrarily. I suppose I could fool around with using the weighting that the OWGR use, but I suspect in this case we would see the same final results because of Tiger’s two WGC wins and his Players Championship win. Maybe in the future I’ll look into that.
Stricker’s table:
http://thesandtrap.com/b/imgs/numbers_game/2013_steve_stricker_zscore.jpg
This gives numbers of:
Accumulated Total Z-Score = -29.163
Rounds = 47
Average Z-Score = -.620
So the accumulated value is just a bit worse than Tiger’s, and the average value is actually better. Obviously, Stricker didn’t meet the minimum rounds requirement for the award, otherwise he might have had a solid case.
Many thanks for this contribution and all the work that went into making up the tables. Made for great reading.
Thanks for adding the Stricker numbers…Assuming he had played the min rounds, without winning a single tournament, I don’t think he would have much support as POY even if he was the most consistent with the best Z score. I think Tiger rightfully got POY because he won the most, not because he had the best Z score.