
 “He’s on a hot streak.”
“Rory just can’t miss right now.”
“You want Webb Simpson on your fantasy team this week, he’s been playing great the last few months.”
The hot streak. Long defended by athletes, denounced by statisticians. It pops up in discussions about three-point shooting, batting titles, and blackjack, but I want to talk about golf.
I don’t really care about putting hot streaks, and it would have taken me a decade to comb though the data to chart individual rounds, but there was one thing I could check out: tournament finishes.
I wanted to see how a player’s finish in one tournament (“event A”) could be used to predict their finish in the next tournament (“event B”).
My hypothesis going in was, with some reservations, that there must be something to the hot-hand theory. We’ve all seen the kind of streaks Tiger and Rory have gone on where they seemingly can’t miss a putt, and we’ve all had our own streaks where nothing seems to go straight. I figured most pros would go through the same thing.
But the results told a largely different story.
To set up this experiment, I collected data from the top 50 players in 2013 FedExCup regular season points. I picked 2013 because the 2014 season hadn’t concluded when I began this project, and I picked those particular players because I could virtually ensure that they had all played a full season (and thus hadn’t taken too much time off between events). I realize that the top 50 is an imperfect sample (I might have found more consistency – albeit consistent mediocrity – from, say, the 120th-ranked player), but 50 players was already pushing the amount of time I was willing to spend.
I stuck to one single season for the same reasons – any more and I’d have driven myself insane, and I’d have a several-month hole in the data. I couldn’t completely eliminate big gaps, of course – Tiger Woods, for instance, played one event in January, one in February, a few times in March, once in April and May, and heavily throughout the summer – but I did all I reasonably could.
Due to the goofy way the PGA Tour’s website presents their data, I had to do something about missed cuts. The site doesn’t specify the difference between finishing 80th and 120th – they’re all listed as MC. I decided to simply give every missed cut the value of a 100th-place finish. It’s an imperfect solution, but I figured it was the best that I could do.
I decided early on that I wanted to go a little more in depth than just how event A affected event B. That’s relatively simplistic, and doesn’t really account for streaks.
I used these four event combinations:
- A -> B
- A+B+C -> D
- A+B+C+D+E -> F
- A+B+C -> D+E+F
I figured that this should give my results a bit of weight. Not only could I measure how one tournament led to the next, but how one month of tournaments led to the next.
After collecting all of the data and consolidating it, I ran a linear regression (fancy, Nate Silver-speak for “I used the ‘CORREL’ function in the Numbers application to find a correlation between two sets of data points”) for each event combination.
I expected pretty strong correlations, particularly for the more broad event combinations. Intuitively, it just seemed like I’d seen too many players catch fire and too many bad ones languish for the hot hand theory to hold no weight.
What I got surprised me in a few ways.
The first big surprise was that the correlations were pretty weak. You can see them below (a perfectly direct correlation is, of course, 1):
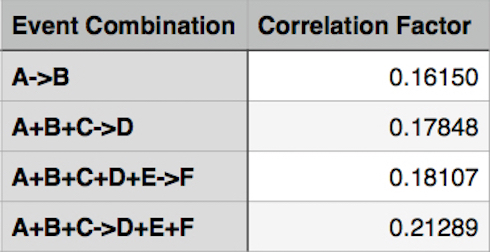
The second surprise was that the correlation factor barely deviated between the various event combinations. I was right that the final combination would produce the highest correlation, but not by much.
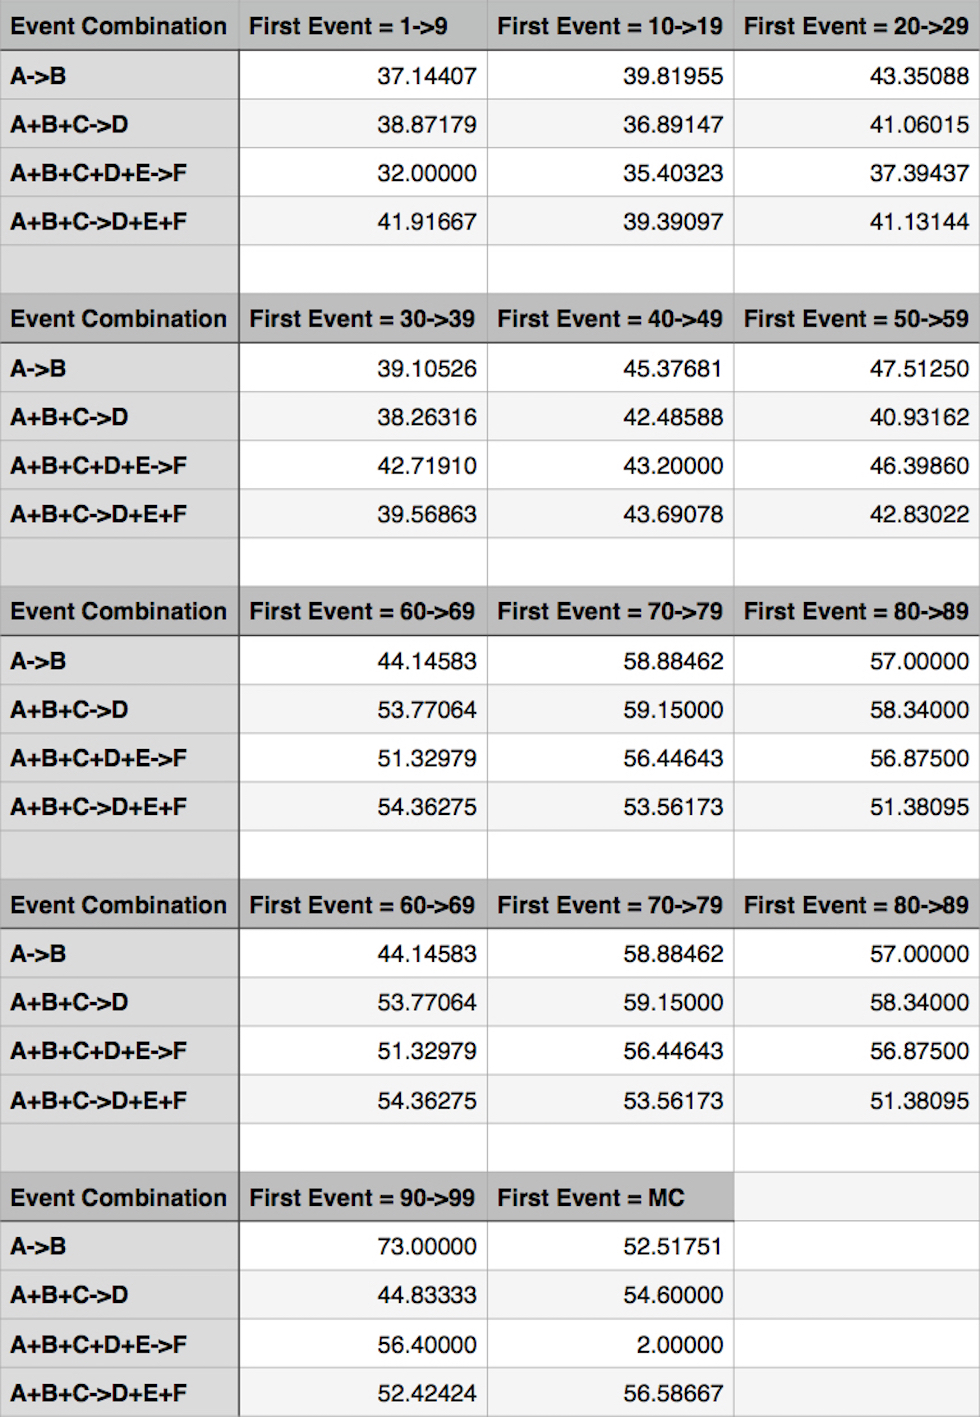
To get a better grasp on the results, I decided to organize my results a bit differently. It was obvious when I laid out my results that players in the top 10 consistently finished better the next week than players who had finished in the 70s the previous week. So I grouped together the A event data in 10-point increments, as you can see below:
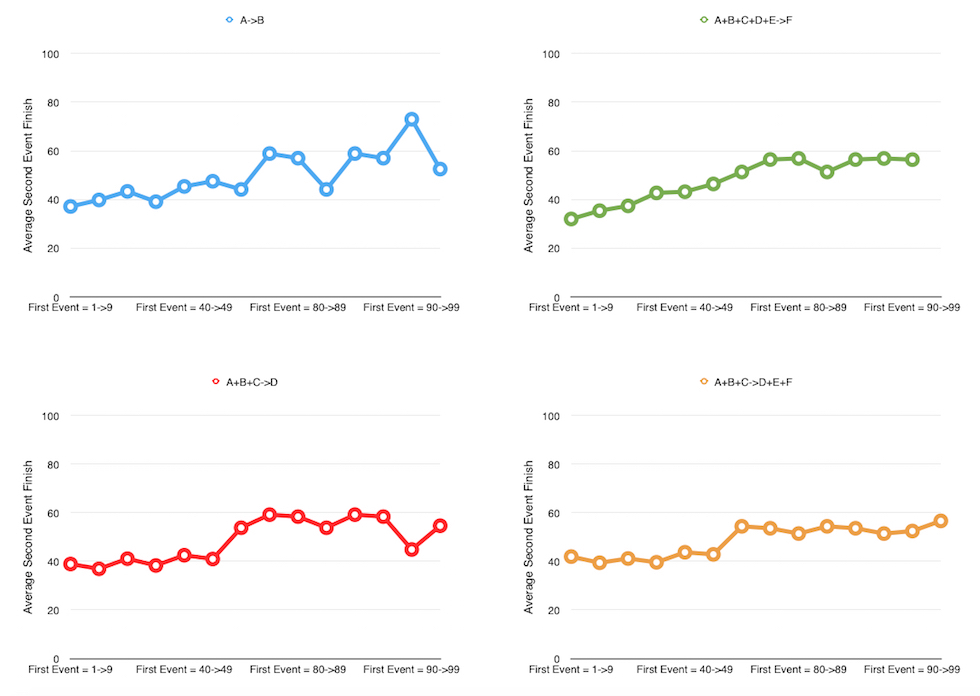
This even allowed me to graph my findings.
There are, of course, limitations and caveats to this little experiment. As I mentioned, I only used data from that top 50 players. This meant that I got all of the game’s truly great players (those who are consistently good), as well as many of the game’s middling professionals. But I didn’t really see the records of the consistently mediocre guys – those who very consistently miss a lot of cuts and don’t have a lot of high finishes – reflected in these results. I’m not entirely sure how it would have shaken out (there’s a decent case to be made that those players are too bad, relatively speaking, to matter much, and would have made the Tour as a whole look much more consistent via their frequent cut-missing), but at least it would have been more complete. I suspect that if I were to add in data from all the guys who very consistently miss cuts (whose previous finishes thus very accurately predict their next finishes), those correlations would go up. Probably not a lot, but maybe some.
The fact that I counted all missed cuts as a 100th-place finish probably had a similar effect.
My use of tournament finish rather than, say, score to par, was another confounding factor. It’s not a perfect proxy for how well a player is playing (z-score actually would have been a pretty good option there if it wouldn’t have taken me years to compile), but it gives a pretty good measure.
Oh, and one interesting tidbit for the road: only one player whose data I looked at missed five cuts in a row. It was David Lingmerth. His next tournament? Finished second at the The Players Championship. Golf is weird.
Nice article for math nerds like me!
Interesting stuff. Thanks Jamieson.
Jamo,
Interesting idea. You gave a good description of what you did, so that helps stat fans understand the process.
You might want to consider this the pilot study for the Hot Hand Project, and enhance the research using the 2014 season data. I’ll send you a PM with some suggested design upgrades.
(Note: Rather than an experiment, this is a field study, because you’re analyzing a phenomenon as it occurs naturally. An experiment would require you to manipulate the environment to change it, such as: Group 1 gets extra training, Control Group gets no training.)
Again, solid job on documenting your procedures!
Great article! Fun read. No wonder I stink at Fantasy- I’m always subconsciously using the hot hand theory