 If you were like me and many other golf fans, you spent Sunday afternoon watching an exciting finish to the Senior PGA Championship. Both Brad Bryant and Jay Haas made nerve wracking birdie putts on the final hole of regulation to send the championship into extra holes.
During those three holes, Haas spent most of the time scrambling around and sinking longer putts to keep himself alive. Bryant, on the other hand, could not rekindle the magic he had on #18 in regulation and lost the tournament by missing a four footer on the last playoff hole, which happened to be #18 again.
This week in The Numbers Game, I thought it would be an appropriate time to take the 40-30-20-10 rule and see if it applies to the Senior PGA players as well as it does to the PGA Tour and LPGA Tour. We saw just how important the 30 (putting) was in those final few holes. Will the others fall into their normal place? Read on to find out.
The Rule
If you haven’t read about the 40-30-20-10 rule before, you can brush up here. The rule weighs four categories of a player’s performance in order to determine or predict his finishing place. The weighted numbers are: 40% greens in regulation (GIR), 30% putting (putting average and putts per round), 20% driving distance (DD), and 10% driving accuracy (DA). I have run the numbers for the PGA Tour and the LPGA Tour to confirm that it indeed applies to both. Now the Seniors are up for inspection.
The sampling of data was a bit smaller for the Champions Tour. Where there was well over 100 players on the PGA and LPGA tours that had enough rounds last year to be ranked in each of the categories. Last year there were only 80 golfers on the Champions Tour that did the same. While it would have been better to have a bit more, 80 is a big enough sample for my needs.
The Results
I didn’t have any specific expectations or predictions before compiling the data. The only thought I had was that the 40-30-20-10 rule would fit much like it did for the PGA and LPGA tours. Both had strong correlations to the rule that surprised even me. The Champions Tour was more of the same.
This graph compares the results of the 40-30-20-10 rule by the actual results, as determined by the Champions Tour money list:
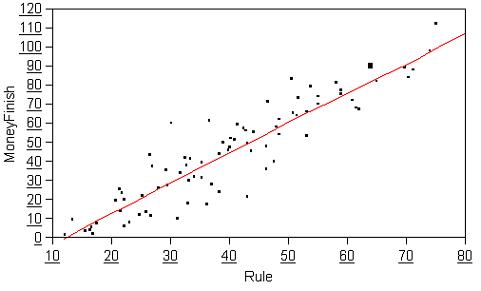
The fit line looks pretty good, huh? I’ve used fit lines before and it produces an RSquare value when generated. The closer the RSquare value is to 1 (a perfect fit) the better your fit. The RSquare value for the Champions Tour for the 40-30-20-10 rule is 0.85. That’s pretty damn solid.
You’d even think that the red line was supposed to be straight. Well, it is a polynomial fit and can curve to fit the points if need be. If we compare it to a linear (straight line) fit, you’ll see just how little it moves:
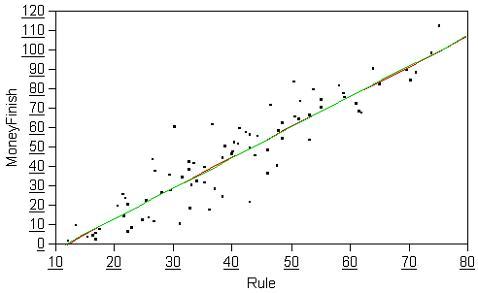
The green line is the linear fit. You can barely see where our first fit line (polynomial) even moves. Just for fun, let’s look at a fit line that should curve even more – a quadratic fit:
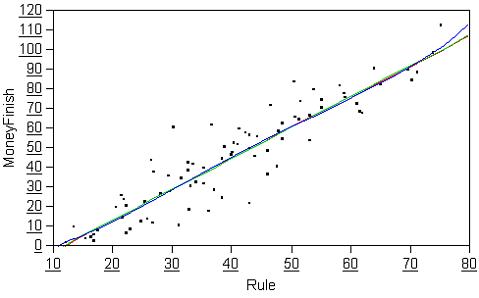
Only towards the end does the quadratic (blue) fit line move. The RSquare of 0.85 and muted movements of the fit lines are great indications that the 40-30-20-10 is a solid rule not only for the PGA and LPGA Tours, but the Champions Tour as well.
Top 10
One other thing I wanted investigate was how the top 10 fared in each of the categories to see if there were any anomalies. We see on the PGA Tour players like Tiger and Phil dominate the earnings with not only great short games, but length off the tee giving us a false sense of the influence driving distance has on earnings. Are the same things happening on the Champions Tour?
Name             Earnings     GIR    DD    DA    PA    PPR
--------        ----------    ---    --    --    --    ---
Dana Quigley    $2,170,258     5     23    11    2      2
Hale Irwin      $1,983,596     5     41    8     12     28
Mark McNulty    $1,791,452     1     49    17    5      20
D.A. Weibring   $1,550,030     3     31    19    21     27
Tom Watson      $1,532,482     9     30    38    6      17
Tom Jenkins     $1,484,315     2     17    43    33     60
Gil Morgan      $1,364,170     9     6     37    20     41
Morris Hatalsky $1,355,336     22    63    14    1      1
Craig Stadler   $1,274,719     13    7     45    2      15
Des Smyth       $1,238,876     23    36    25    38     45
----------                    ---    --    --    --    ---
Averages                      9.2   30.3  25.7  14.0   25.6
Looking at the numbers, GIR leads the way… which isn’t surprising. The top seven players on the Champions Tour in 2005 were in the top 10 in GIR. This makes the case for the importance of GIR better than any of the other tours I’ve researched. Only putting average (PA) was close with 5 out of the top 10 players in the top 10 of that stat.
One interesting thing is that DD average place was lower than DA for the top 10. DD had the lowest average of the five stats used in calculating the 40-30-20-10 rule. You might think that you can make the case that DA would be more important on the senior circuit, but when I flopped the 20-10 from DD-DA to DA-DD, the RSquare value dropped from 0.85 to 0.81. The top 10 might be a bit different, but the rest of the group favors distance over accuracy ever so slightly.
Another item worth noting: the top putter and GIR player are both in the top 10, but the longest driver and most accurate are not. Morris Hatalsky is first in both putting stats but 63rd of 80 in DD. That made him over $1.35 million last year. Not bad for a short knocker.
Thoughts
The way golf is played today, it isn’t biased. Success is dictated by how many, or more appropriately how few, strokes are taken to complete a round. Take the names away from each round of golf and all you have left are numbers: how many greens someone hit, their putting stats, driving numbers, and strokes taken. This data is universal for all golfers from PGA, LPGA, and Champions Tour players to you and me.
The 40-30-20-10 rule at first was meant to be somewhat of a guide, but I’m finding that it applies more and more to the golf everyone plays rather than just guys like Tiger and Phil. Not everyone out there is going to hit 14 greens in a round, but the high handicappers can look at it from a different perspective. If you hit the green when you should and putt the ball well, I guarantee you will score better than a day you hit the ball long or accurately off the tee.
Not only is the data universal, Golf is universal.
2 thoughts on “Do Seniors Follow the Rule?”