Jump to content
Check out the Spin Axis Podcast! ×
IGNORED

Dispersion Statistics: What are yours?


Note: This thread is 5311 days old. We appreciate that you found this thread instead of starting a new one, but if you plan to post here please make sure it's still relevant. If not, please start a new topic. Thank you!

Recommended Posts

Posted

I posted a thread a while back about, instead of using a single index to sort of 'state your game,' using three figures instead.  It was met with some "hmmm, interesting" as well as some "what's the point"'s.  In another thread, talk of people shooting far lower than their handicap led me to a chart that The Pope of Slope put together on probabilities of a player's two lowest differentials being X strokes lower than their index.  It all just got me thinking more on, there must be some (relatively) simple and concise way to measure the thing we all want from our game, and thus, I think, want to know about others', too - consistency.  Though the megalomaniac in me would love to think that one day the "Sonicblue Disperson Statistic" becomes an official USGA figure, maybe it's just for this thread, so let's just see what we've all got here?

Index itself is unchanged, but then there are three other figures to go with it, all stated relative to your index:

1) Average of your TWO BEST differentials

2) Average of your middle TEN (ranks 6-15)

3) Average of your TEN worst (ranks 11-20), aka "anti-handicap"

Round to the nearest whole number, and you can ignore saying "plus/minus," because the first will always be <0, and the second two will always be >0. I am an 8.0 index, and my dispersion is 3/4/8.  This is sorta like saying, "if I'm on, I can score +5, but I'll most likely play +12 and, look out, I could pop to a +16" (all relative to the slope-adjusted course rating).  Um...I am not consistent...

I went on GHIN and pulled some stats for some friends and/or players I know.  Those results are:

A) +2.5, 3/2/5

B) 1.1, 2/2/5
C) 3.9, 1/2/4
D) 4.5, 1/2/4
E) 7.2, 1/1/3
F) +1.8, 4/4/6

A and F are known as two of the best players at my club.  It wasn't surprising to see their first stat very high (meaning, they occasionally go very low), but interesting to see how F's middle stat is quite high, and each's third stat is quite high.  B, C and D are all very similar, but E stands out: this basically says 15 of his 20 scores are within +/-1 of his index, and his other five scores average only +3.  THAT'S consistency.

Like any handicap, yes, it's subject to fraud and intentional sandbagging, so let's just worry about who uses it correctly.  And, like any statistic, I think it's something worth tracking and measuring and targeting for improvement.  Post yours!

Nothing in the swing is done at the expense of balance.


Posted
Somewhat confusing. How does a basic standard deviation look using those numbers? I'm thinking that it would give you same information is a much easier to read format. Side note: I've been pushing for a standard deviation in Scorecard but iacas just won't budge!

Yonex Ezone Type 380 | Tour Edge Exotics CB Pro | Miura 1957 Irons | Yururi Wedges | Scotty Cameron Super Rat | TaylorMade Penta


Posted
I understand your concept, but you lost me with the numbers. When you say "A) +2.5, 3/2/5" what do each of the numbers represent again?

In my bag:

Driver: Titleist TSi3 | 15º 3-Wood: Ping G410 | 17º 2-Hybrid: Ping G410 | 19º 3-Iron: TaylorMade GAPR Lo |4-PW Irons: Nike VR Pro Combo | 54º SW, 60º LW: Titleist Vokey SM8 | Putter: Odyssey Toulon Las Vegas H7

Awards, Achievements, and Accolades

Posted

It means A is a +2.5 handicap, where his two best differentials average to three less than that, his middle ten rounds average to 2 above that, and his highest ten rounds average to 5 above that.  I leave off the 'less than' and 'greater than' because, by nature of the math, the first number will ALWAYS be less than your index, and the other two will ALWAYS be higher.

Nothing in the swing is done at the expense of balance.


Posted


Originally Posted by jamo

I understand your concept, but you lost me with the numbers. When you say "A) +2.5, 3/2/5" what do each of the numbers represent again?


I'm glad I wasn't only one a bit confused.

Mizuno MP600 driver, Cleveland '09 Launcher 3-wood, Callaway FTiz 18 degree hybrid, Cleveland TA1 3-9, Scratch SS8620 47, 53, 58, Cleveland Classic 2 mid-mallet, Bridgestone B330S, Sun Mountain four5.


Posted

I'm 25.1 3/6/12.

Note that the number you cite as the "anti-handicap" doesn't agree with the definition I've seen---that is, since the handicap is 0.96 * average(10 best), anti-handicap is 0.96 * average(10 worst), rather than just the average.  I used the straight average---if I scale by 0.96, I get 11 instead, so no big deal.

Sort of interesting.  I'm not sure it's the friendliest format for thinking about the meaning of the numbers, but the idea that you want to look at more than just the average is a good one.  Another approach would be to find a family of probability distributions for a golfer's handicap.  The one-parameter version would use the handicap index as its parameter and would represent the average distribution of differentials for all golfers at that handicap.  From there, one could add a spread parameter for a two-parameter family, so that it could represent consistency as well as average skill.  You are heading toward the three-parameter family that adds a skewness---how often does the golfer go higher than expected versus lower than expected.  Your scheme does capture those parameters, but if we had a ton of data I bet we could pick these apart and really come up with an optimal set.

But really, what I think is missing is a sense of scale / significance.  Taking myself as an example compared to your A-F cases, my first number (3) is on par with your A/F, but my anti-handicap is far larger.  This means that I tend to beat my handicap by about the same amount on my best rounds, but that when I have a bad day, it's a really bad day.  Is that surprising?  Probably not---since my handicap index is so much larger, I'm almost surely subject to larger random fluctuations in performance.  I take an extra 25 strokes compared to those guys, so I have a lot more opportunities for random good or bad luck.

What this means is that the x/y/z numbers are not really independent of the handicap---that is, their magnitude probably scales with handicap index.  That sort of redundancy can be problematic when interpreting statistics.  Finding the normalization to scale that away can probably be done, and would be helpful.  That could tell me, e.g., that perhaps I'm less consistent than a typical 25.1 handicapper, so I should focus on consistency to get rid of the high scores before I get hung up on perfecting other details.  As it stands, I suppose your numbers might be best used to predict who's going to be a successful golfer in net tournaments, but I'm not sure how to use them to track progress.

In the bag:
FT-iQ 10° driver, FT 21° neutral 3H
T-Zoid Forged 15° 3W, MX-23 4-PW
Harmonized 52° GW, Tom Watson 56° SW, X-Forged Vintage 60° LW
White Hot XG #1 Putter, 33"


Posted

You might be interested in reading this article from Chance, Winter 2001, on how the USGA handicap system is biased against the more inconsistent player of two golfers with the same handicap.

http://www.isds.duke.edu/~dalene/chance/chanceweb/141.kupper.pdf

I like this analysis, by the way. My numbers are  9.7. 3/4/6. The question is, what would you do with the information to even out competition?

Someone with a stronger math background than I have could answer this, but isn't 20 observations a rather small number around which to calculate a meaningful standard deviation? And even more so if only the lowest 10 differentials make up the data set?


Posted

I just got an interesting reply back from Dean Knuth, the Pope of Slope himself.  Concise, but quite telling (some spelling/grammar errors left in, I imagine he is busy with more important things, lol):

"Back when I was a researcher for the USGA, our Handicap Research Team (HRT)  ran many math models on "the search for the perfect handicap".  I recall that from more than 100 models, the best was a normal model that used the mean and the std deviation as the two numbers that golfers would be issued.  Reaction for the USGA committees was that it was two complex when I will also introducing the Slope System.  Years later I studied and liked a way to class players by their games,  Average Andy, Steady Eddie and Wild Willy.  (A, S and W) after the Handicap Index.  That was considered too complex as well"

So, the upshot is, the USGA wants nothing to do with anything more than "here's your index," and by extension, doesn't seem to care about the potential inequities that result from not having any sort of standard deviation/disperson/consistency measure.  *shrug*  I'm still going to track mine, because even if I can't lower my handicap, I think it's still a measure of improvement to lower my dispersion stats.

Nothing in the swing is done at the expense of balance.


Posted

I just got an interesting reply back from Dean Knuth, the Pope of Slope himself.  Concise, but quite telling (some spelling/grammar errors left in, I imagine he is busy with more important things, lol):

"Back when I was a researcher for the USGA, our Handicap Research Team (HRT)  ran many math models on "the search for the perfect handicap".  I recall that from more than 100 models, the best was a normal model that used the mean and the std deviation as the two numbers that golfers would be issued.  Reaction for the USGA committees was that it was two complex when I will also introducing the Slope System.  Years later I studied and liked a way to class players by their games,  Average Andy, Steady Eddie and Wild Willy.  (A, S and W) after the Handicap Index.  That was considered too complex as well"

So, the upshot is, the USGA wants nothing to do with anything more than "here's your index," and by extension, doesn't seem to care about the potential inequities that result from not having any sort of standard deviation/disperson/consistency measure.  *shrug*  I'm still going to track mine, because even if I can't lower my handicap, I think it's still a measure of improvement to lower my dispersion stats.

Again, I have to ask, what's your standard deviation? Is that a simpler number to track? I think so. Here are some numbers; [code] 71 0.9 68 -2 74 3.7 72 2.8 75 4.7 73 2.8 72 1.8 74 3.7 73 2.8 73 2.8 72 1.8 65 -4.8 75 4.7 74 3.7 73 2.8 72 1.8 77 6.6 72 1.8 73 2.8 65 -4.8 [/code] [list=a] [*]Average of your TWO BEST differentials [b]-4.8[/b] [*]Average of your middle TEN (ranks 6-15) [b]2.59[/b] [*]Average of your TEN worst (ranks 11-20), aka "anti-handicap" [b]3.83[/b] [/list] So, by your calculations my numbers would be; 0.2 5/3/4 This confuses me quite a bit. The first number shows that I can go low. The second says that I'm generally +3 strokes vs the differential. The last number shows that on a bad day, I'm +4 over the differential. Is that good or bad? What does that tell me? To make matters worse, my first number looks terrible due to 2 great rounds (terrible when you're looking for consistency, after all, based on your calculations, 3 very low numbers indicate absolute consistency). Turn those 65's into 68's and my first number becomes 2, that's a pretty volatile calculation that can greatly influence future estimations. At a glance, this doesn't mean a whole lot, at least not to me. Taking a deeper look, based on a course rating of 70, I can expect to shoot anywhere from 65 (rating - A) and (rating + C) 74 with an average around 73 (rating + B). Throw out those 65's and numbers change quite a bit (68, 74, 73) which are, arguably more accurate. How about using a RAW mean and standard deviation? [list=a] [*]Average of ALL differentials [b]2.02[/b] [*]Standard deviations of ALL differentials [b]2.81[/b] [/list] On average, I'll play right around 2 over the differential +/- 3 strokes. Assuming a course rating of 70, I can expect to shoot anywhere from 69 to 75 with an average around 72. Based on the numbers above, that looks about right. In the end, the average of all differentials doesn't really matter. In a way, just knowing the USGA index already gives you that information. After all, on average, a golfer will play to a few strokes over their index day to day. Thus armed with that information and a basic standard deviation, you can determine your window of consistency. The lower your deviation, the more consistent you are. It's as easy as that. Furthermore, the standard deviation is less affected by a single round or two. For example, take those 65's and make them 68's (-4.8 differentials vs -2 differentials) and the standard deviation drops from 2.81 to 2.19. Now my assumed range is anywhere from 70 to 74 (perhaps +1 stroke due to the minor difference in index that doing this would create). Looking at the numbers, the standard deviation works, is more accurate (on the whole) than the other method and can be made sense of quickly and easily. That's why I'd love to see this number in the statistics screen of Scorecard. You could, at a glance, in very simple terms, how consistent you are round to round, 9 to 9 or even hole to hole. Standard deviation can be a very informative statistic when you look at it over time and, best of all, it's quick and easy. You can tell what it means, at a glance, w/out any real thought.

Yonex Ezone Type 380 | Tour Edge Exotics CB Pro | Miura 1957 Irons | Yururi Wedges | Scotty Cameron Super Rat | TaylorMade Penta


Posted

I don't see how you can claim that seeing "raw mean = 2, std dev = 3" is very informative, but (once you know what they represent) say that "index = 0.2, dispersion = 5 / 3 / 4" is so confusing?    The standard deviation of all 20 differentials for the six samples range from 1.8 to 3.9.  I also looked at three more guys: a 7, an 11 and a 24.  Their standard deviations 2.4, 3.2 and 3.6, respectively.  There's just not as much room for that statistic to vary, I don't think.  The dispersion stats aren't any harder to calculate once you have differentials, and is certainly easier than standard deviation for the lay person (if you've got a spreadsheet, hell, anything is easy to calculate).  Yes, they require interpretation in context of the index, but I don't think that's difficult, either.

I thought maybe coefficient of variation would be good (std dev / mean) but, when the mean is close to zero, that ratio blows out (and can be undefined if the mean happens to hit zero dead-on).

I agree standard devation is a valid measure and useful, but I just think that over time, watching it go from - say - 3.5, to 3.3, to 3.1, etc..., is sort of a slow, thankless process.  For the dispersion stats, I can tell you, what I'd ultimately like to see is, mine going from the 3/4/8 they're at, to something like 4/2/4.  That is, I have three numbers that can change, maybe more quickly, by more than just fractions like std dev, and each tells me something.  Frankly, I don't want 1/1/1.  For the level I'm at, I want to see my first number get higher, to gain the ability to 'really be on' sometimes, and then my last two numbers decrease, and get closer, to imply that 'off' doesn't mean 'holy s**t, what happened to my game??"  As my index (hopefully) drops, I would have to have lower expectations on that first number (which is why I find that -1.8's first number of 4 so amazing; as good as he is, he occasionally goes unconsciously good).  In contrast, my current std dev is about a 4.  I'd probably have to get a bunch of good rounds in to get it to go to...what....a 3?

I think in terms of a snapshot, yes, standard deviation is probably a good one-time measure of "how consistent am I?"  For tracking/improvement, I think the dispersion stats provide a little more feedback on where you are or aren't consistent, and are more responsive to the progress you make toward becoming more consistent.

Nothing in the swing is done at the expense of balance.


Note: This thread is 5311 days old. We appreciate that you found this thread instead of starting a new one, but if you plan to post here please make sure it's still relevant. If not, please start a new topic. Thank you!

Create an account or sign in to comment

You need to be a member in order to leave a comment

Create an account

Sign up for a new account in our community. It's easy!

Register a new account

Sign in

Already have an account? Sign in here.

Sign In Now


  • Want to join this community?

    We'd love to have you!

    Sign Up
  • TST Partners

    PlayBetter
    Golfer's Journal
    ShotScope
    The Stack System
    FitForGolf
    FlightScope Mevo
    Direct: Mevo, Mevo+, and Pro Package.

    Coupon Codes (save 10-20%): "IACAS" for Mevo/Stack/FitForGolf, "IACASPLUS" for Mevo+/Pro Package, and "THESANDTRAP" for ShotScope. 15% off TourStriker (no code).
  • Posts

    • Day 457 - 2025-12-31 Stayed after some GEARS Hybrid stuff with my senior girls and got some work in. Also, kicked Tegan's butt at a chipping contest with a wedge that has a lousy toe profile.
    • Day 141 12-31 Reconnecting arm and club face work. Making sure left wrist is arched only on the downswing. Not doing full swings, im pausing at the top and will do a few rehearsals.  Hit a few real balls  after, and had some curve way left. 
    • That was a good watch. When I started working on pelvis in the backswing. I thought, this sounds contradictory to those leg straightening threads on the site. Erik has already done a correction. Then the last lesson we went more down the route of feeling the right knee gains flex. It doesn’t, but the feeling keeps my knee position in a good range. Also, I just realized how much extra work my right hip needed to do to stabilize the body with the proper weight shift. Those glute and hip stabilizers got worked. 🤣 I wish this evolution in the golf instruction happened 20 years ago! 😭
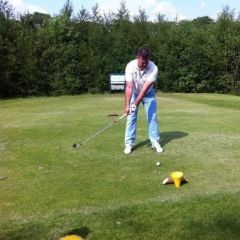
    • I've been Playing Golf for: 40 yrs My current handicap index or average score is: 4.0 factor My typical ball flight is: Straight however sometimes slight draw. The shot I hate or the "miss" I'm trying to reduce/eliminate is: squirt to the right due to to much arm not enough turn. Videos:  [Delete this, Embed Videos Here - https://thesandtrap.com/how-to/embed-videos/]
    • Wordle 1,656 3/6* ⬜⬜🟨🟨🟨 🟩⬜🟨🟨🟩 🟩🟩🟩🟩🟩
×
×
  • Create New...

Important Information

Welcome to TST! Signing up is free, and you'll see fewer ads and can talk with fellow golf enthusiasts! By using TST, you agree to our Terms of Use, our Privacy Policy, and our Guidelines.