
Note: This thread is 5775 days old. We appreciate that you found this thread instead of starting a new one, but if you plan to post here please make sure it's still relevant. If not, please start a new topic. Thank you!
-
Topics Being Discussed Right Now on The Sand Trap
-
"5 Minutes Daily" Practice Challenge 1 2 3 4 1021
By iacas, in Instruction and Playing Tips
- 5 minutes daily
- dedication
- (and 6 more)
- 18,377 replies
- 1,883,603 views
-
- 7 replies
- 331 views
-
- 1 reply
- 114 views
-
- 3 replies
- 594 views
-
- 21 replies
- 6,082 views
-

Announcements
-
TST Partners


Direct: Mevo, Mevo+, and Pro Package.
Coupon Codes (save 10-20%): "IACAS" for Mevo/Stack/FitForGolf, "IACASPLUS" for Mevo+/Pro Package, and "THESANDTRAP" for ShotScope. 15% off TourStriker (no code). -
Posts
-
 Day 12, 1/12/26. Played 18 today. Range was closed so I couldn't do that as warm-up. I haven't had a chance to edit and sign the ShotScope round yet, but I think I did very well driving (despite one lost ball), approach (I hit a ton of collars, amusingly) and even putting.
 -
 It isn't even a brand new concept. It's nothing special. It's just the interpolation of a smaller amount of data sets to develop a heat map. I can do this in Microsoft excel. It's just a fancy way to show ball speed and club head speed, which is just smash factor.
 -
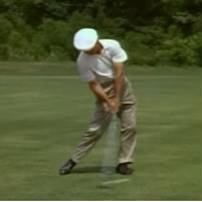
.thumb.JPG.640dd6f31fe7f6aef91f879119bae1d9.JPG) Day 48: mirror work after a long, annoying day. Focused mostly on backswing and getting a bit more width.
Day 48: mirror work after a long, annoying day. Focused mostly on backswing and getting a bit more width. -
 Day 470 - 2026-01-13 Got some work in while some players were using the sim, so I had to stick around. 🙂 Good thing too, since… I hadn't yet practiced today until about 6:45 tonight. 😛
 -
That's not quite the same thing as what some people messaged me today.
-
Recommended Posts
Create an account or sign in to comment
You need to be a member in order to leave a comment
Create an account
Sign up for a new account in our community. It's easy!
Register a new accountSign in
Already have an account? Sign in here.
Sign In Now